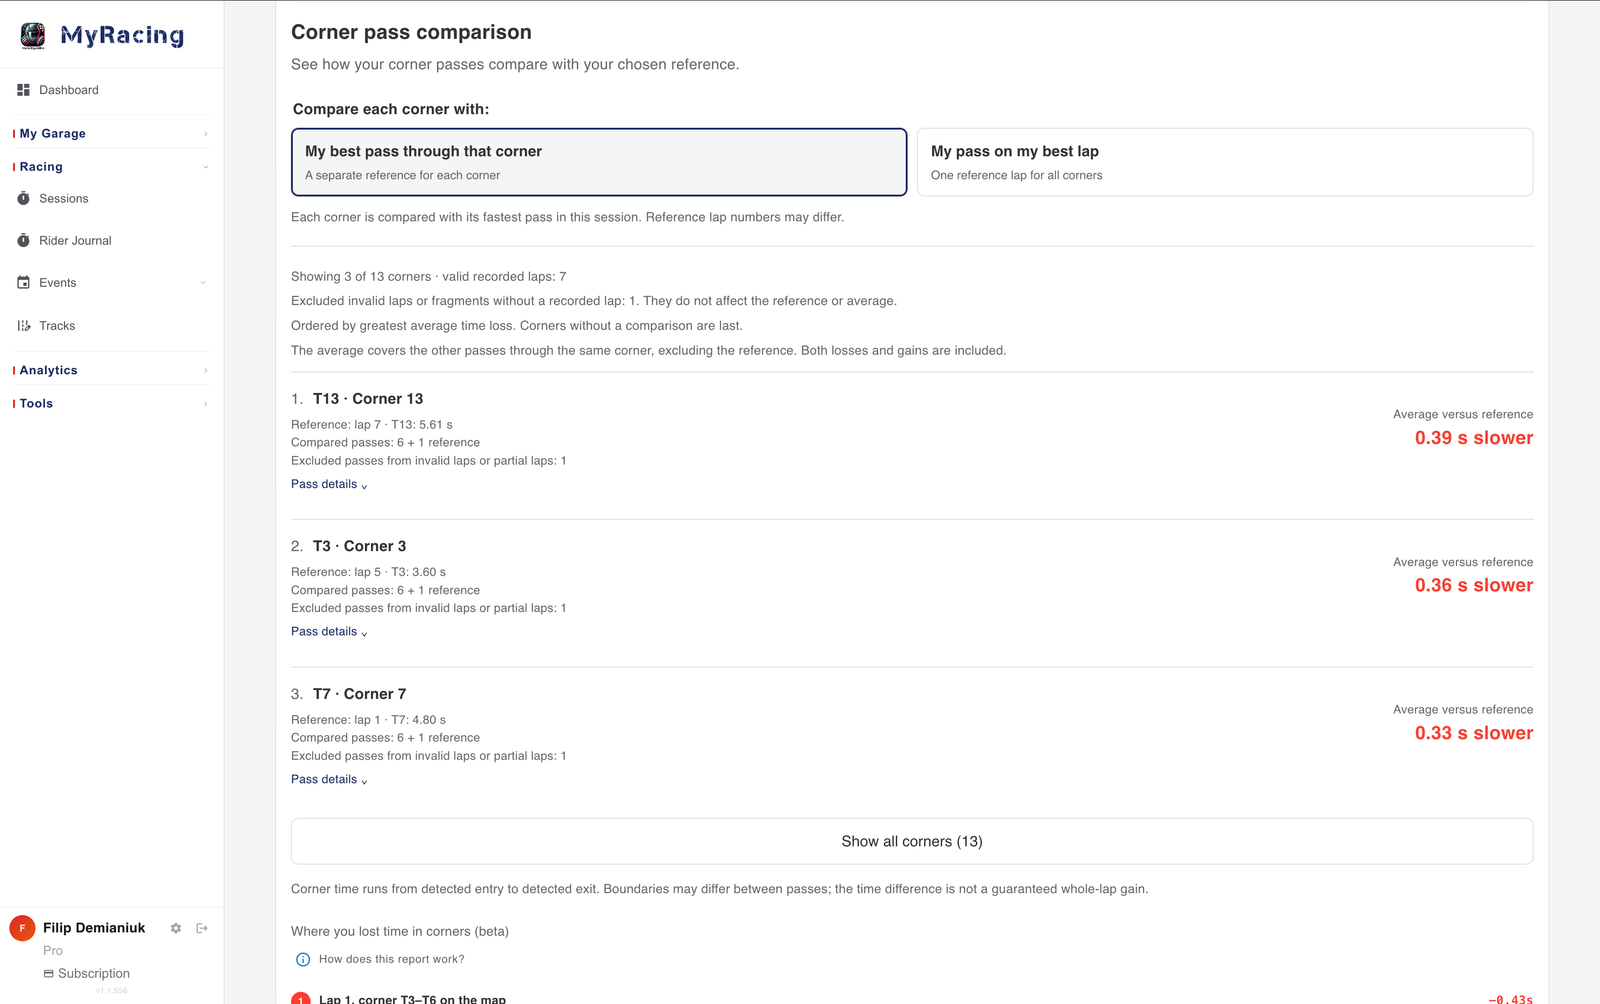
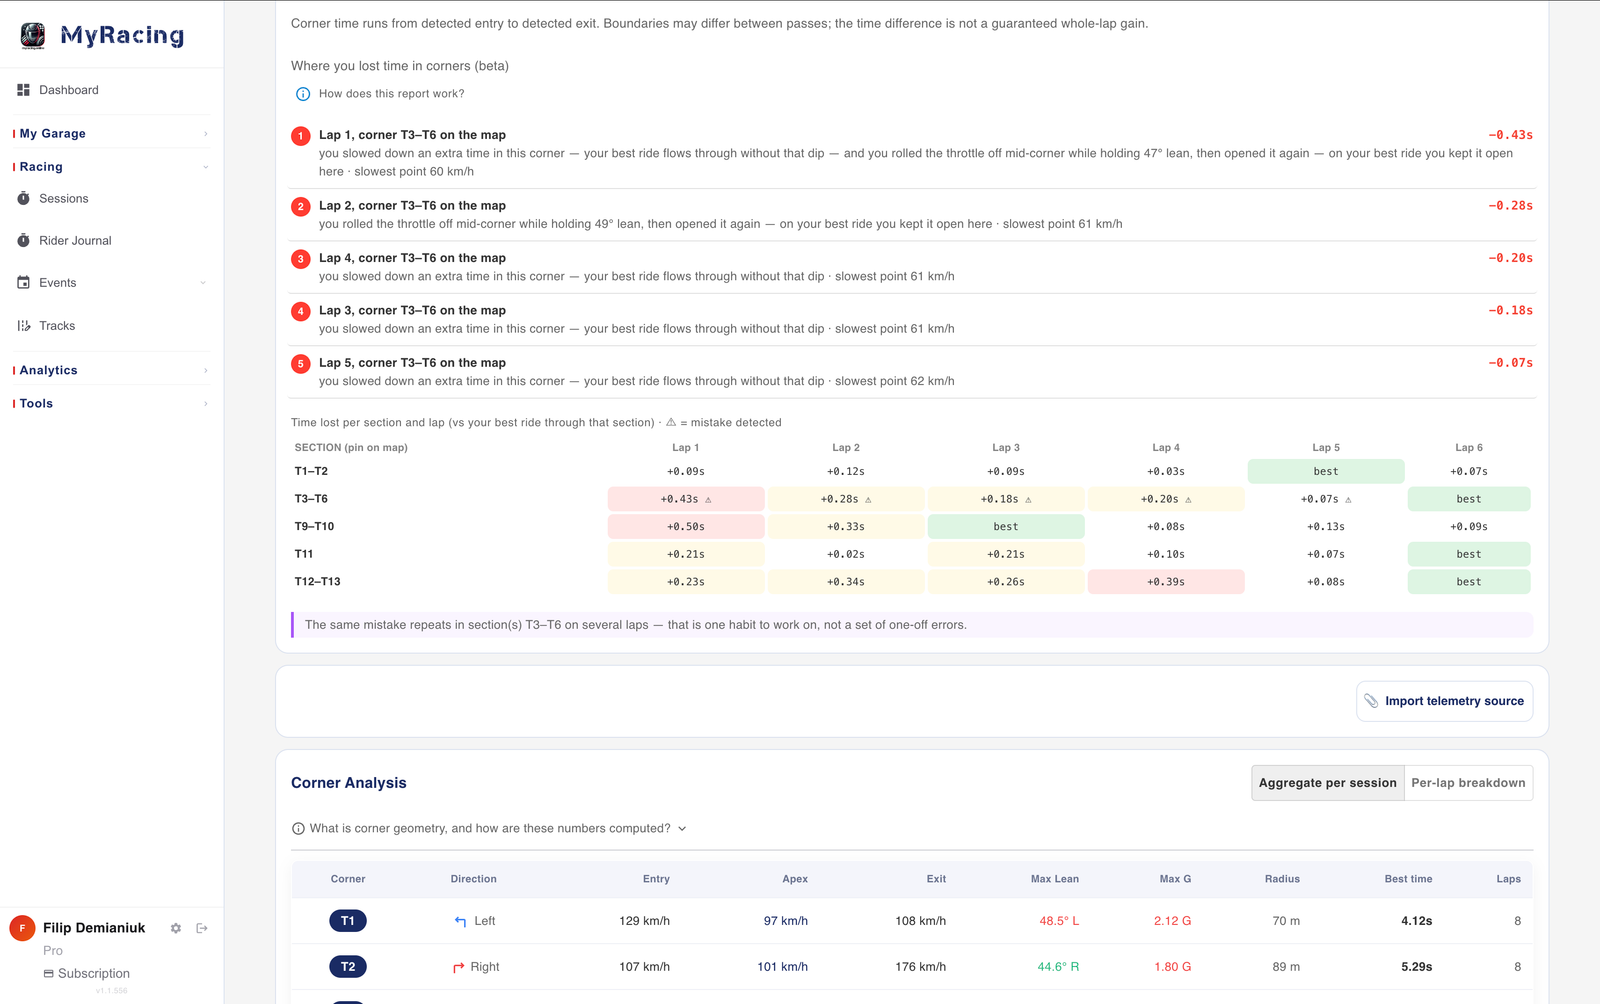
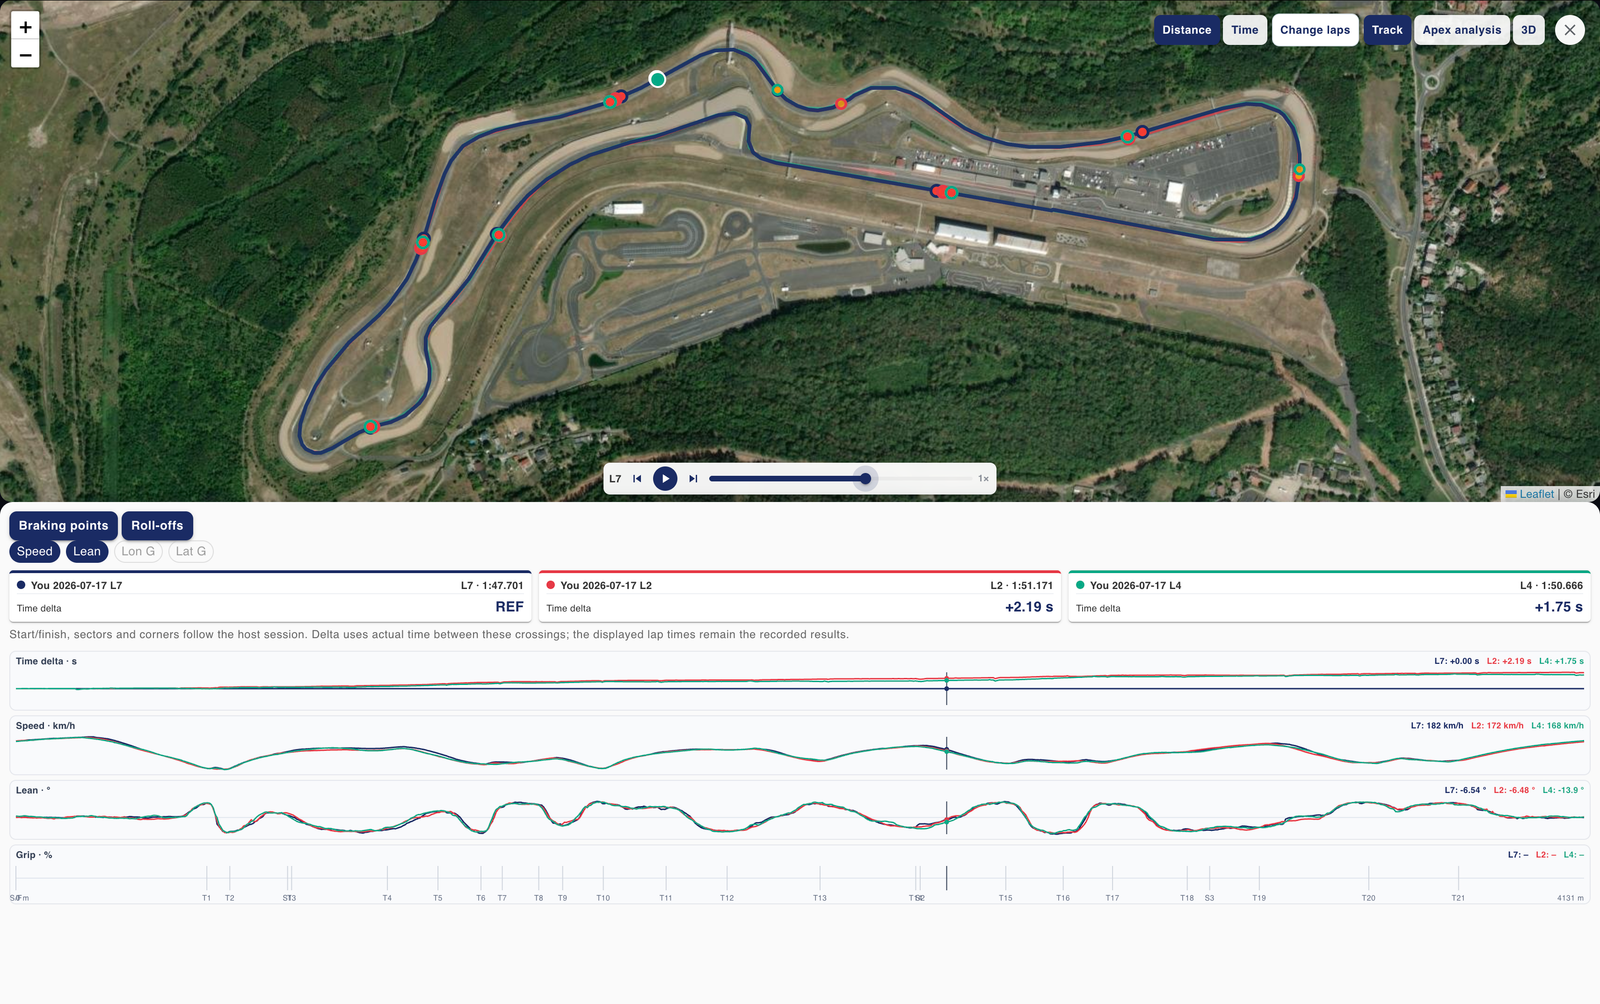
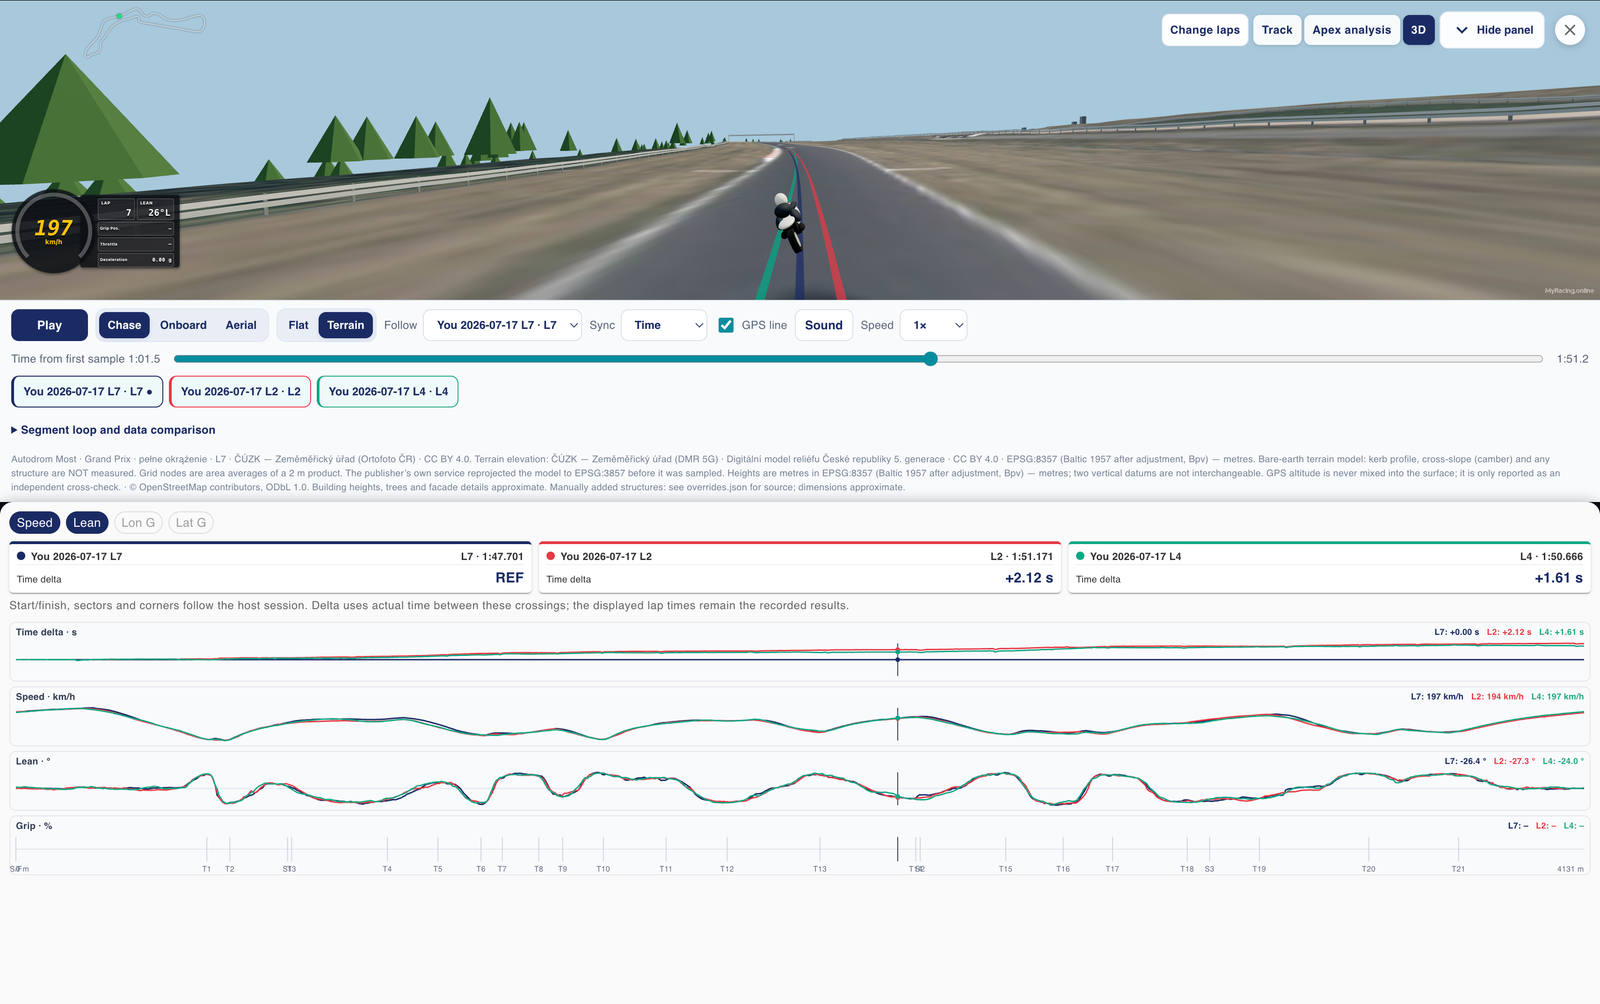
Record with phone or external GPS. Your phone’s GPS and motion sensors record position, speed, lean and G-force. Android can use a compatible u-blox M8, M9 or M10 USB receiver; enable USB-OTG if required by the phone. Supported external receivers can provide up to 25 GPS positions per second, with motion sampling around 100 Hz depending on the phone and configuration. Bluetooth GPS can supply location through an Android mock-location bridge app or an MFi receiver on iOS. Rates depend on the chosen receiver.
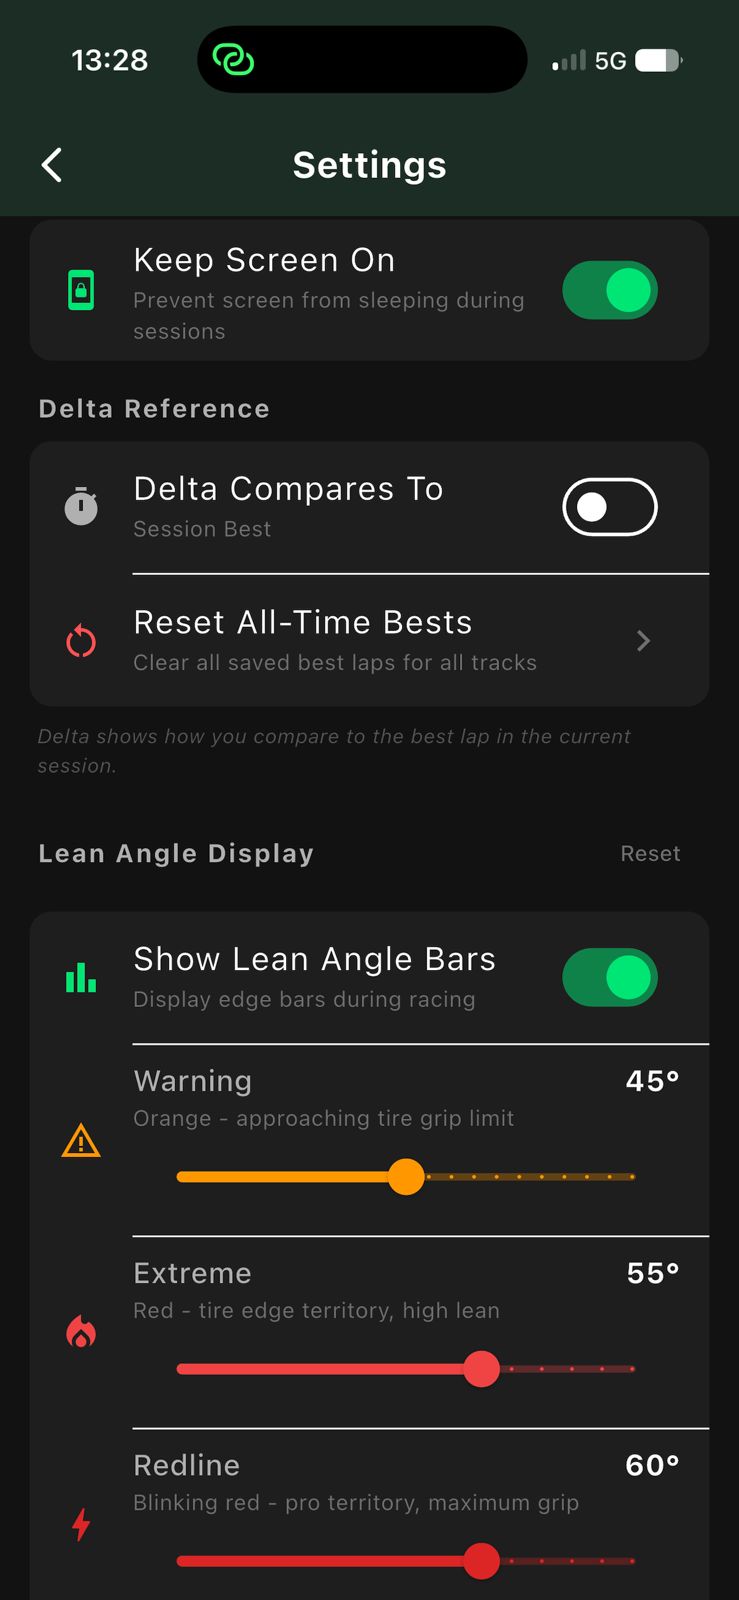
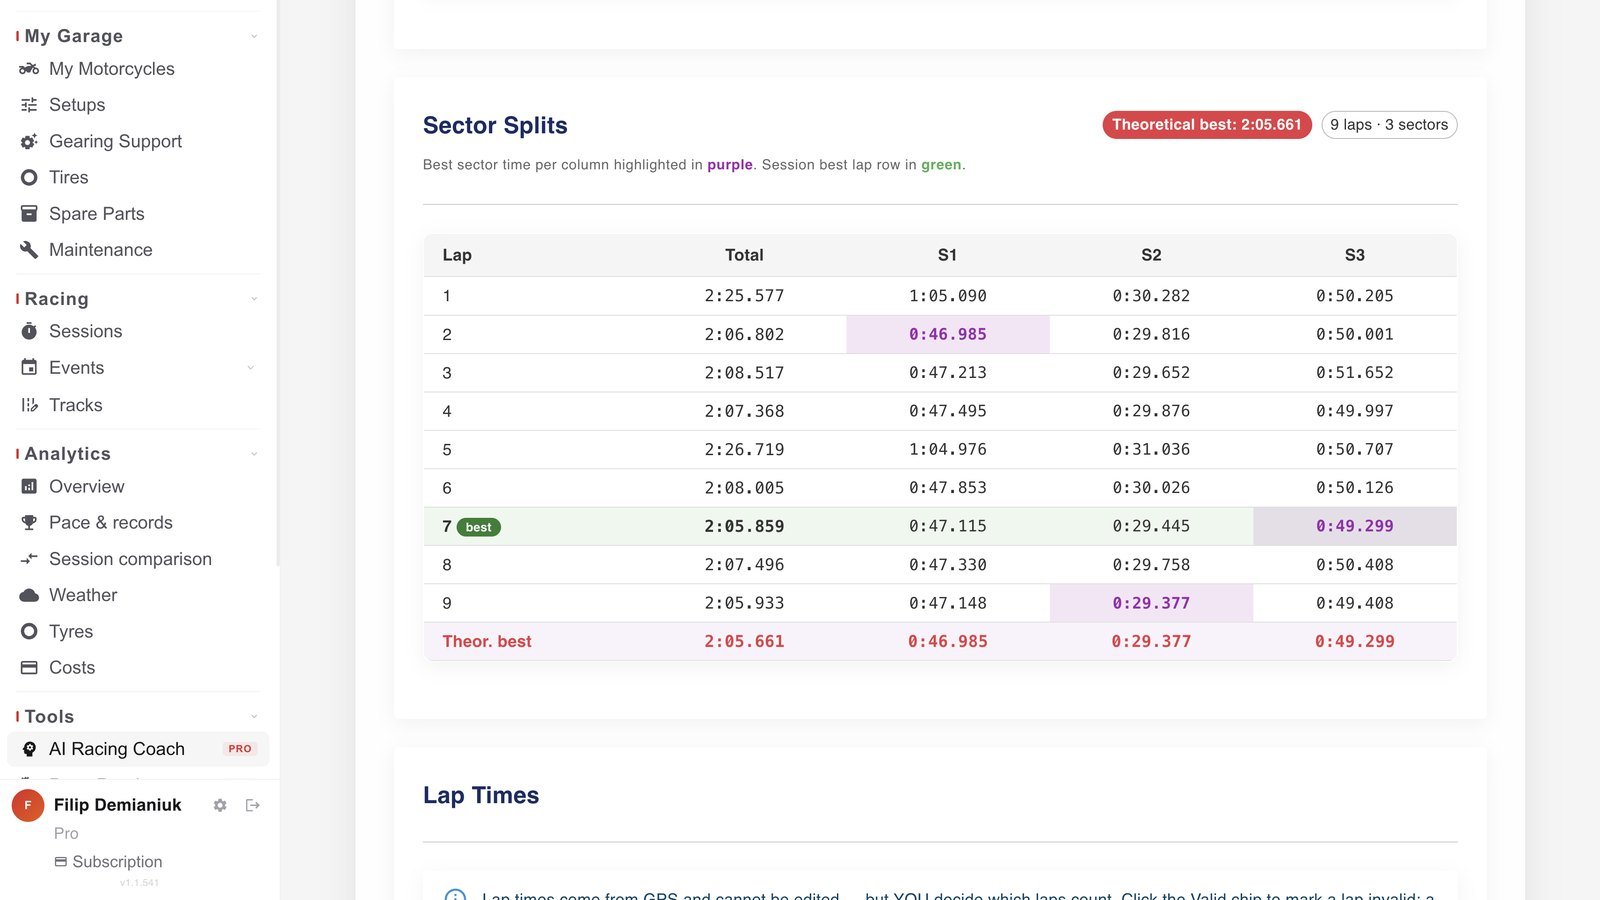
Your pit board, live. Lap and sector times land the second you cross the line, next to a live delta against your best, a projected lap time and a live lean-angle horizon. Your times are called out in your helmet, so you get them without looking down.
Any track, your finish line. Ride an official circuit, or add your own track. Draw your own start/finish line on the map. Either way laps detect automatically. Adjust your own sector lines for sector times analytics.
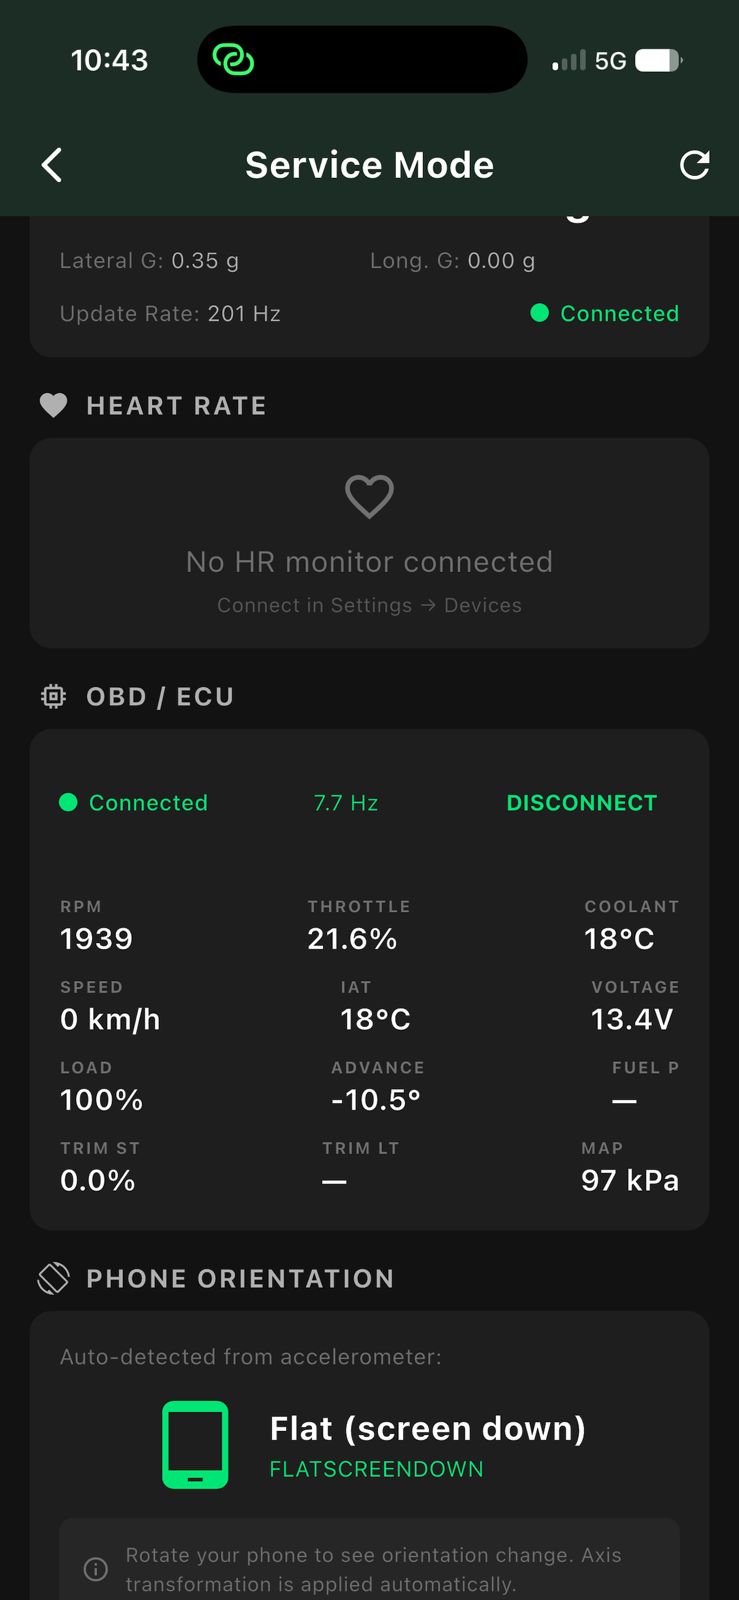
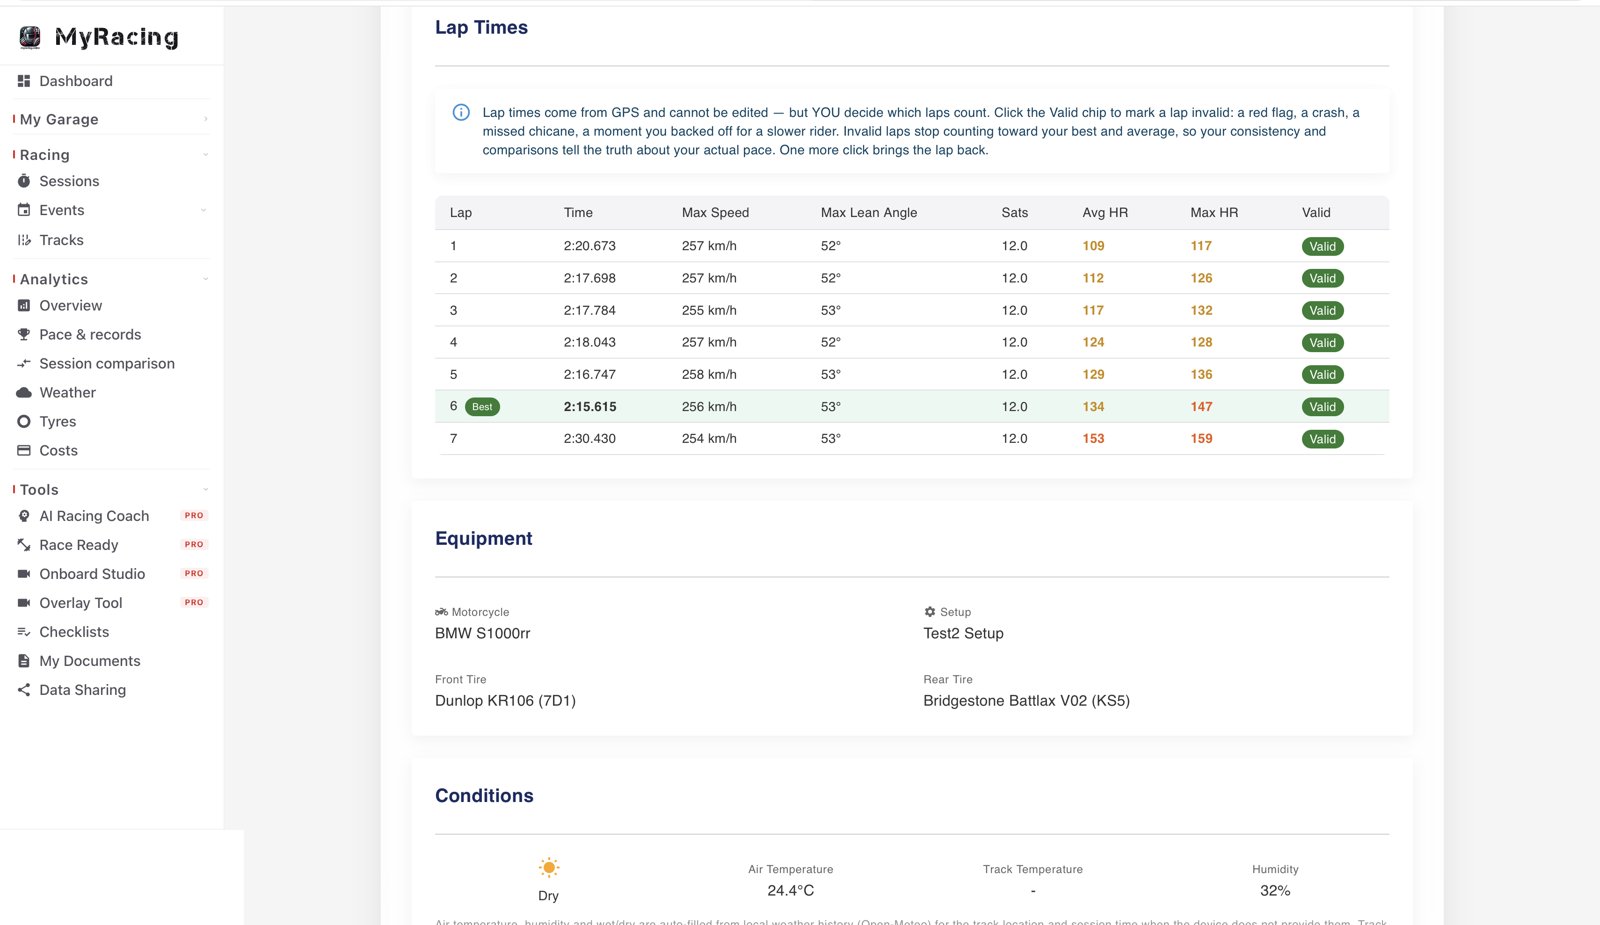
Your heart rate alongside the ride. Pair a sensor that broadcasts the standard Bluetooth heart-rate service. A compatible chest strap or watch can supply readings for the session, allowing you to review heart rate alongside pace. Check that a watch supports broadcasting heart rate to another device.
What the engine was doing. Connect a compatible Bluetooth LE OBD-II adapter with the ignition on to record ECU data alongside GPS. UniCarScan UCSI-2100 is one tested adapter. RPM, throttle, temperatures and other available channels depend on the motorcycle and adapter. Classic Bluetooth (SPP) and Wi-Fi adapters do not connect to Pulse. Check the tested motorcycles and recorded channels →
Set your own ECU alerts. With the relevant ECU channels connected, Pulse can alert you when coolant temperature or voltage crosses a limit you set. Each alert can be switched off individually. A full-screen signal appears during the ride, and the alert is also recorded in the session summary.
Your GoPro rolls itself. Pair a GoPro (HERO9 Black and newer) and Pulse starts and stops it with your session. It even drops a HiLight tag at every lap and sector crossing, so the moments worth rewatching are marked before you open the footage.
Keep the recording with its equipment. Use your MyRacing motorcycle, setup and tyre records to give the session context. Equipment can be assigned when available or completed later. Historical weather can be added from the circuit location and riding time; track temperature requires a physical measurement.
Built for the paddock. Everything records locally on your phone, no network signal needed. Upload later, once you're back in coverage.